Everything you always wanted to know about GDB but were afraid to ask
A practical guide for when your sketch compiles, runs, and still does something wrong — and you need to find out why.
Before You Start
This guide is about one specific kind of problem: your sketch compiles without errors, it runs, and something in its behaviour is wrong. A particle goes to the wrong place. The app crashes after a few seconds. The window freezes. A value slowly turns into NaN. You have no idea why.
The tool for this is GDB. It lets you pause the sketch mid-run, walk through the code frame by frame, and inspect every variable exactly as the machine sees it. This guide shows you how to use it with Umfeld’s setup/draw lifecycle.
! This guide does not cover compile errors.
If your code does not compile, the error message is your starting point — paste it into an LLM with your code and it will usually get you there faster than any debugger.
Step 1 — Build in Debug Mode
GDB needs debug symbols to map the running program back to your source code. A normal build strips most of that information. Before anything else, rebuild in Debug mode.
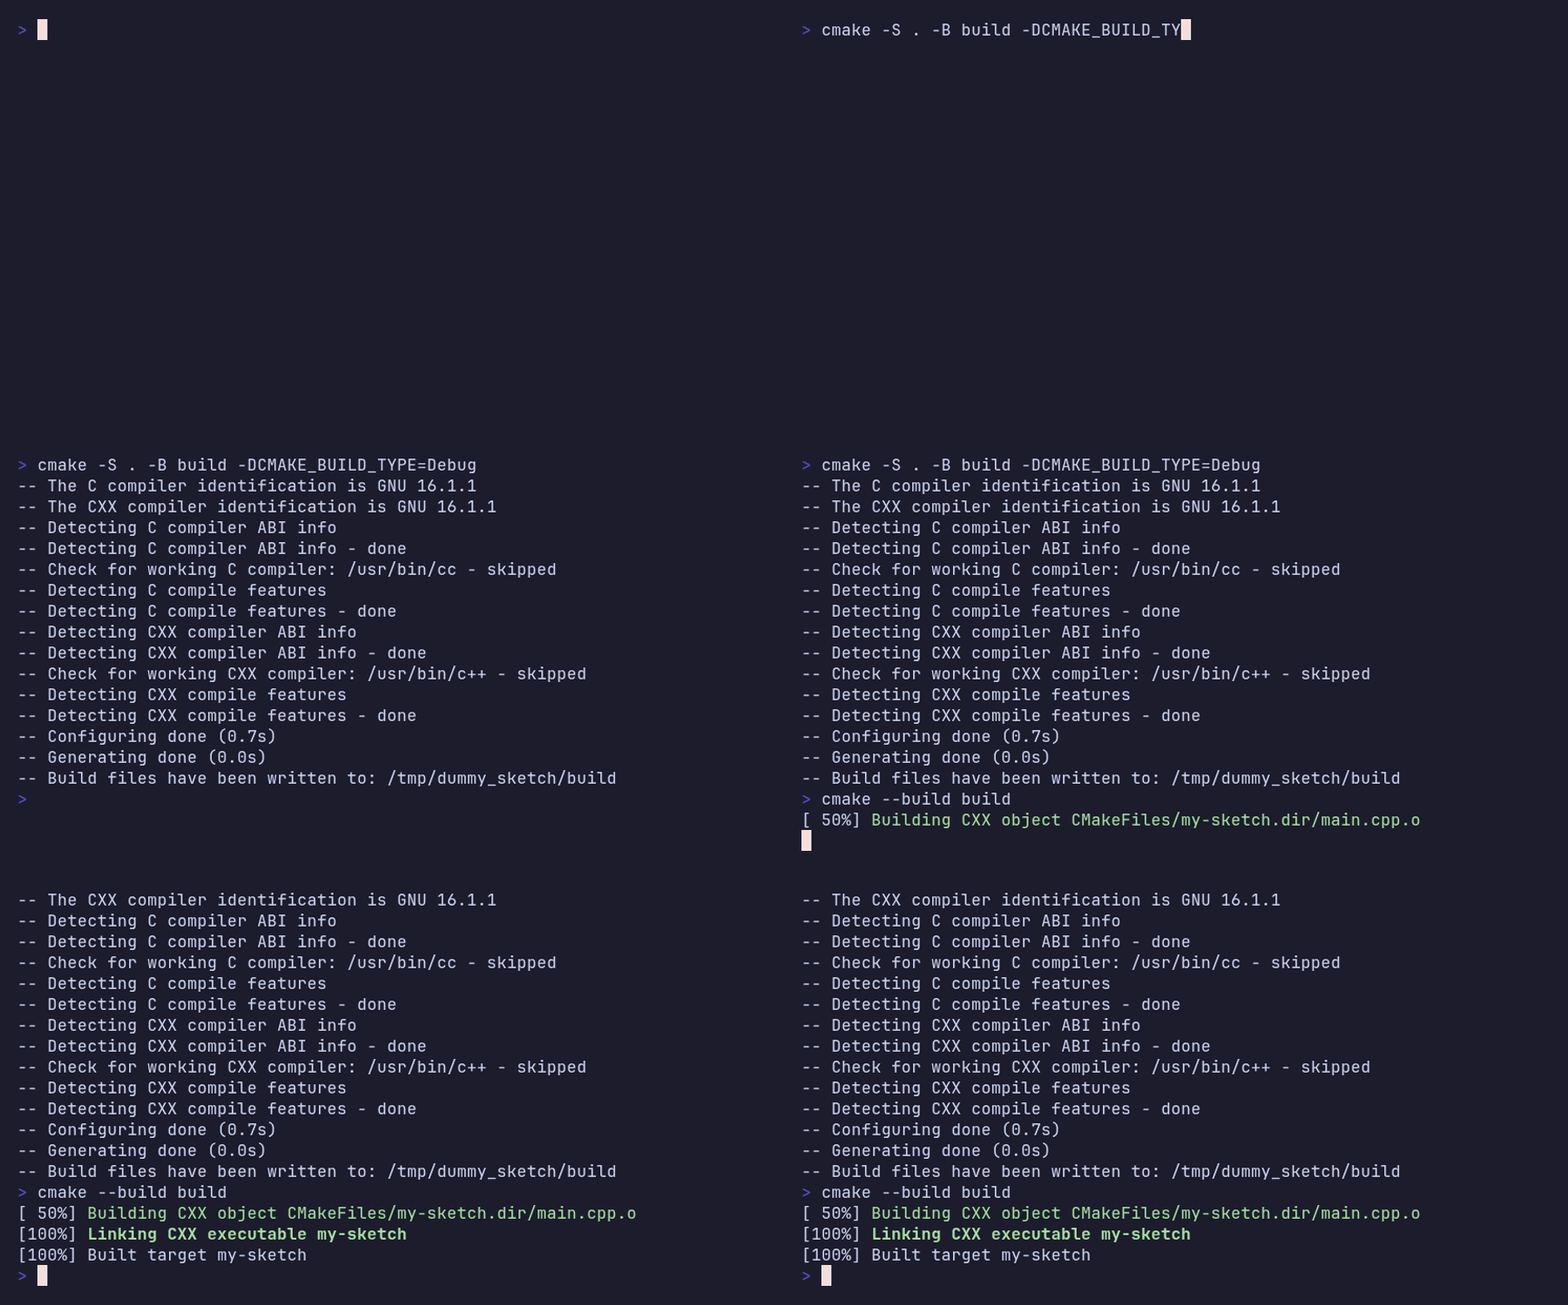
cmake -S . -B build -DCMAKE_BUILD_TYPE=Debug
cmake --build build
✓ Check your binary path.
The built executable lives inbuild/. On most Umfeld projects it will be something likebuild/my-sketch. Verify with:ls build/
Debug mode adds three things GDB depends on: source line information, variable names, and a one-to-one relationship between instructions and your code. Without it, GDB shows you assembly and memory addresses instead of variable names and line numbers.
Step 2 — Launch GDB
Start GDB from your sketch’s root directory. Umfeld sketches often load assets (images, shaders, audio files) using paths relative to where the program was launched from. Launching from the wrong directory is a common source of startup crashes.
Terminal — launch from the sketch root
cd /path/to/your-sketch
gdb ./build/your-sketch-name
You will see GDB’s version banner and then a (gdb) prompt. The sketch has not started yet. GDB is waiting for your instructions.
GDB — start the sketch
(gdb) run
If the sketch runs normally, GDB stays out of the way. If it crashes, GDB catches the crash and leaves everything paused so you can inspect it. That is the first useful thing GDB does for you automatically.
Step 3 — Inspect What Happens at Startup
Umfeld calls setup() once before the draw loop starts. This is where window size, audio devices, assets, and initial simulation state are configured. If something is wrong from the start, setup() is where to look.
Set a breakpoint before running. A breakpoint tells GDB to pause the moment a specific function is about to execute.
GDB — break at setup
(gdb) break setup
(gdb) run

# GDB pauses here. The sketch window has not appeared yet.
(gdb) info locals     # every local variable in setup()
(gdb) print width     # inspect a specific variable
(gdb) print height
(gdb) continue        # let the sketch keep running
→ info locals is your first instinct.
It prints every variable in scope at the current point. If a value looks wrong here — wrong resolution, uninitialised mesh, empty asset path — you have found the bug before the draw loop even starts.
To inspect an object or struct, GDB prints it with all its fields. To make the output readable, turn on pretty printing first:
GDB — readable output for structs and containers
(gdb) set print pretty on
(gdb) set print object on
(gdb) print myParticleSystem
(gdb) print vertices       # works on std::vector too
(gdb) print vertices.size()
Step 4 — Something Goes Wrong in draw()
The draw loop runs sixty times per second. Breaking inside it without a condition stops the sketch on every single frame — which is useless. The trick is a conditional breakpoint: GDB only pauses when a specific condition is true.
Break on a specific frame
(gdb) break draw if frameCount == 300
(gdb) run

# Sketch runs normally until frame 300, then pauses.
(gdb) info locals
(gdb) continue
Break when a value goes wrong If you know which variable is misbehaving but not when, break the moment it reaches a bad state:
# Pause when a particle's x position becomes invalid
(gdb) break Particle::update if isnan(velocity.x)

# Pause when a counter exceeds a limit
(gdb) break draw if activeParticles > 10000

# Pause when a pointer becomes null
(gdb) break draw if mesh == nullptr
✓ Conditional breakpoints have low overhead.
In a 60 fps loop with a simple condition (isnan, comparison) the performance cost is negligible. Complex expressions involving string comparisons can slow things down noticeably.
Step through the code line by line
Once GDB has paused inside draw(), you can move through the code one step at a time:
next      # execute the current line, stay in this function
step      # execute the current line, follow calls into other functions
finish    # run until the current function returns, then pause
continue  # resume normal execution until the next breakpoint
Step 5 — The App Crashed
When a sketch crashes, GDB catches it automatically. The program is paused at the exact instruction that caused the crash. Your first command is always bt — backtrace.

GDB — crash workflow
(gdb) run

# Crash happens. GDB prints something like:
# Program received signal SIGSEGV, Segmentation fault.

(gdb) bt           # print the call stack at the moment of crash
(gdb) bt full      # same, plus local variables on every frame
The backtrace is a list of functions that were active when the crash happened. Frame 0 is the innermost — the exact instruction that faulted. In a creative-coding app, that is often deep inside a library (SDL, OpenGL, a codec). The actual bug is usually higher up, in your code.
GDB — navigate the backtrace
(gdb) frame 0      # select the innermost frame
(gdb) list         # show the source around this line
(gdb) info locals  # inspect variables at this frame

(gdb) up           # move one frame toward your code
(gdb) info locals  # inspect at this frame
(gdb) up           # keep going until you reach application.cpp
→ Look past the library frames.
It is normal for frame 0 to be insideSDL_GL_SwapWindowor an OpenGL call. Useuprepeatedly until you see your own file name in the backtrace. The bug lives there.
The three most common crashes
- SIGSEGV — null or dangling pointer, out-of-bounds array access, use-after-free
- SIGABRT — a failed assertion, or an allocator that gave up
- SIGFPE — division by zero, or a NaN passed into a math operation that requires a finite value
Catching crashes from C++ exceptions Some crashes arrive as unhandled exceptions rather than signals. Catch them at the throw site to see what threw and from where:
(gdb) catch throw
(gdb) run

# GDB pauses the moment any exception is thrown.
(gdb) bt
Step 6 — A Value Goes Wrong Somewhere
Sometimes you know what is wrong — a position becomes NaN, a counter hits a number it should never reach, a pointer goes null — but you have no idea where in the code it happens. This is what watchpoints are for.
A watchpoint tells GDB to stop execution the instant a specific variable is written to. You do not need to know which function does it.
GDB — set a watchpoint
# First, break somewhere the variable is in scope
(gdb) break setup
(gdb) run

# Now set the watchpoint
(gdb) watch particle.position.x
(gdb) continue

# GDB stops the next time position.x is written.
# The printout shows the old value and the new value.
(gdb) bt            # see which function wrote it
(gdb) info locals
Other watchpoint forms
watch *somePointer      # stop when the pointed-to value changes
rwatch audioBuffer[0]   # stop on read of this value
awatch sharedFlag       # stop on read or write
→ Watchpoints find the needle in the haystack.
If a value is being corrupted 500 frames in and you have no idea where, a watchpoint will catch it in seconds. This is often faster than adding dozens of print statements.
Step 7 — The Window Froze
A frozen or unresponsive window usually means a thread is stuck — waiting on a lock that will never be released, spinning in an infinite loop, or blocked on a GPU call that never returns. GDB lets you inspect all threads at once.
Attach to a running sketch If the app is already frozen, you can attach GDB to it without restarting:
Terminal — find the process and attach
pgrep your-sketch-name        # get the process ID
gdb ./build/your-sketch-name <pid>

# Or from inside GDB if it is already open:
(gdb) attach <pid>
GDB — inspect all threads
(gdb) info threads             # list every thread and its current state
(gdb) thread apply all bt      # backtrace every thread at once

# Switch to a specific thread
(gdb) thread 2
(gdb) bt
(gdb) info locals
What to look for in the backtrace of each thread:
- Main thread: blocked inside event polling or a mutex wait
- Audio callback thread: holding a lock the render thread is waiting on
- Asset loader: stuck in a file read or a decoder loop
- Any thread: waiting inside a GPU call with no valid context
→ thread apply all bt is your best first command for a hang.
Paste all the output somewhere and read each thread’s top frame. The frozen thread will usually be obvious — it is the one sitting inpthread_mutex_lockor a tight loop.
Common Umfeld Crash Patterns
Crash immediately on startup Usually: wrong asset path, audio device not found, OpenGL context failure.
(gdb) break setup
(gdb) run
# Step through setup() with 'next' and watch where it stops.
(gdb) next
(gdb) next
# If it crashes before setup() — check bt for static initializers.
(gdb) bt full
Crash after N frames Usually: out-of-bounds access, use-after-free, accumulated NaN.
(gdb) break draw if frameCount > 500
(gdb) run
# Sketch runs to frame 500, then you can step toward the crash.
Position or velocity becomes NaN Usually: division by zero, normalising a zero-length vector, bad physics integration.
(gdb) break Particle::update if isnan(position.x) || isnan(velocity.x)
(gdb) run
(gdb) bt
(gdb) info locals
# Look at anything being divided. Check vector lengths before normalize().
App slows down badly over time
This is not a GDB job — it is a profiler job. GDB pauses are too coarse-grained to diagnose performance regression. Use perf or gprof for that. GDB is for correctness, not speed.
Save your breakpoint setup across sessions
Create a .gdbinit file in your sketch directory. GDB loads it automatically on startup.
.gdbinit — example project config
set print pretty on
set print object on
set pagination off
break setup
break draw if frameCount == 1
Terminal
gdb -x .gdbinit ./build/your-sketch-name
A More Comfortable Interface
Plain GDB works, but reading source in your head while typing commands is tiring. Two zero-installation options make it easier.
GDB TUI — built in
TUI mode splits the terminal into a source pane and a command pane. You can see exactly which line you are paused on without typing list.
Terminal
gdb -tui ./build/your-sketch-name
GDB — TUI commands
layout src      # source view
layout split    # source + assembly
focus cmd       # move keyboard focus back to the command area
VS Code — if you prefer a GUI VS Code’s C++ extension connects to GDB and gives you clickable breakpoints, a variable inspector, and a call stack panel. You still need a Debug build — VS Code does not change that.
- Install the C/C++ extension (
ms-vscode.cpptools) - Add a
launch.jsonpointing to your Debug binary - Use the Debug Console tab to type raw GDB commands alongside the GUI
Quick Command Reference
Everything above, condensed.
run                              start the program
break setup                      pause at setup()
break draw if frameCount == 60   conditional pause in draw()
break Particle::update           pause at a method
continue                         resume after a pause
next                             step over (stay in current function)
step                             step into (follow calls)
finish                           run until current function returns

bt                               print the call stack
bt full                          call stack + local variables
frame 2                          select stack frame 2
up  /  down                      move up or down the stack

info locals                      all variables at current frame
info args                        arguments of current function
print myVar                      inspect one variable
ptype myVar                      show its type
set print pretty on              readable struct output

watch myVar                      pause when myVar is written
catch throw                      pause on any C++ exception

info threads                     list all threads
thread apply all bt              backtrace every thread
thread 2                         switch to thread 2

attach <pid>                     attach to a running sketch
detach                           release the process
quit                             exit GDB